Key facts:
-
Only a couple of times over the past 7 years, bitcoin has fallen below the indicator.
-
Bitcoin’s market cycles support $20,000 as a floor for the price.
Will we see bitcoin (BTC) with a market price below $20,000 again? With the cryptocurrency falling to its lowest levels this year and suffering to retake the 30,000, this seems the question to be answered today. And there is an indicator that could give peace of mind to those who bought over the $20,000 mark.
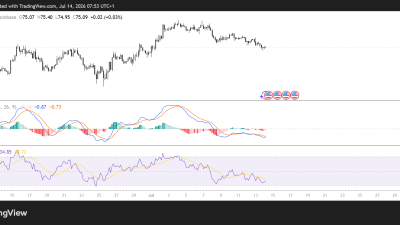
The indicator in question is the weekly moving average 200. Or, what is the same, the average of 200 weeks that varies according to price fluctuations. At this moment, this indicator is above $21,000. It means that this is the average price for bitcoin in a 200-week range.
But what does this data indicate about the near future for cryptocurrency? Rather, we would have to go back to the past to get that possible answer: as they reflect TradingView data, has only a couple of times crossed down, hard, the level of that average. It was in the midst of the pandemic collapse of March 2020 and it lasted just over a week.
Before that, it also happened for a couple of weeks between August and September 2015. A third example of such a crossing it was given in December 2018. But it wasn’t significant enough.
Now, if we refer to the historical, we can see that in a span of about 7 years, between June 2015 and the present, that crossing can be considered as a complete rarity. Just about three weeks below the indicator mark in more than 2,500 days.
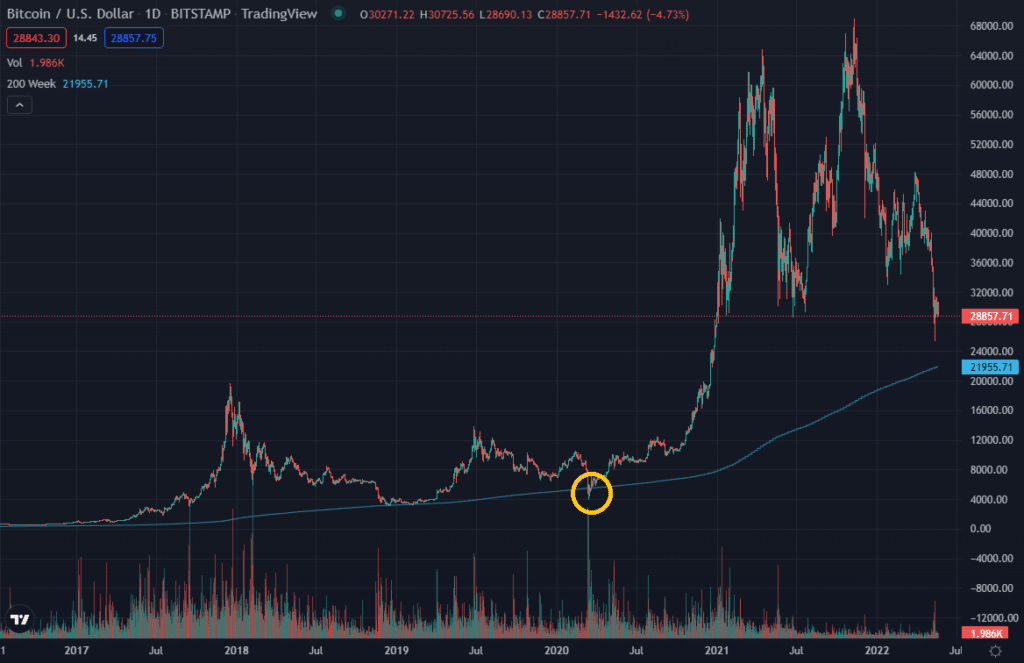
Another detail that could indicate that those levels below 20,000 will not return, is the fact that that moving average has historically remained up. While fluctuations and a long-sustained bear market could bring it down, so far the cryptocurrency’s continued appreciation trend has only gone up.
Halving and historical bitcoin market cycles
The $20,000 mark is important for the bitcoin price history, not only because of the aforementioned indicators and data. It also represents the mark of the all-time high corresponding to the previous market cycle.
Historically, the reduction in the issuance of bitcoins (which is halved approximately every 4 years through the halving) has been accompanied with increases in the price levels of the cryptocurrency.
In the current cycle, after the 2020 halving, so far there has been a cap on $69,000. And in the previous one, the maximum had been precisely around 20,000.
As with the indicator of the 200-week moving average, the data of the top of the cycles can shed light on the future of the price. So far, each cycle has not only served to set new price highs, but the floor has also increased at every opportunity.
Never in history has the price fallen below the maximum of the previous cycle. Therefore, a drop of BTC below $20,000 would be quite a challenge to the brief history of the cryptocurrency.
Despite these data, there are those who believe that this historical challenge could indeed occur. At least, that’s the position of economist Harry Dent, as we reviewed in Criptonews this Thursday: for him, bitcoin (and all financial markets) still expect the worst. In the particular case of BTC, it foresees a fall of between $3,000 and $7,000 in a bear market that would reach until 2024.


Comments