
Key facts:
-
Bitcoin’s spot price is less than 10% of the realized price, Glassnode says.
-
By crossing the spot price the realized price curve, it would signal a price floor.
The price of bitcoin is getting closer and closer to its realized or cash price, which further drives the accumulation of this cryptocurrency. In its most recent Week-on-Chain report, the analytical firm Glassnode argues that bitcoin reached this level last week by touching USD 26,513, its lowest value since December 2021.
The realized price or effective price of bitcoin is one of the oldest and most fundamental metrics in the analysis of chain data, notes the report. It is calculated by dividing the sum of the values of all coins at the time they were last moved, by the circulating supply. “Therefore, the realized price reflects an estimate of the aggregate cost base of all the currencies in the supply,” it states. This means that the realized price could be associated with a weighted average of all the purchased BTC.
On the other hand, Glassnode highlights that the realized price “has provided solid support during bear markets and has provided signals of market bottom formation when the market price trades below it.” In this sense, this metric can be very useful in this bear season since it serves as an indicator at what time to buy or the percentage of losses that an investment may have, if we take into account that this is the potential minimum price that it will reach.
The following table shows the previous bear market cycles and the proportion of time that prices traded below the realized price.
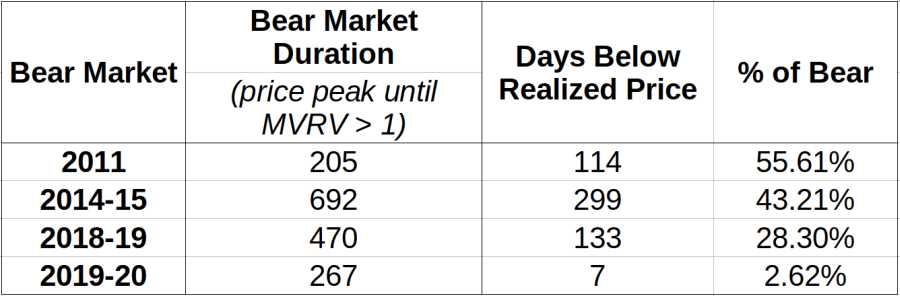
It is appreciated that each bearish cycle has had less and less relative duration below the realized price. “This may be partly due to the general awareness of the market about its existence (it was first discovered in 2018),” says Glassnode. In March 2020, there were only 7 days below the realized price, instead of months as happened in previous cycles, the report highlights.
“Last week, when the price reached the minimum of USD 26,513, the realized price was traded at $24,000.” According to the report, prices plummeted due to the liquidations of both bitcoin and Luna, together with the collapse of UST and fears about the temporary decoupling of Tether with the dollar. This led to a drop in spot prices to just 9.5% of the realized price, as can be seen in the chart below.
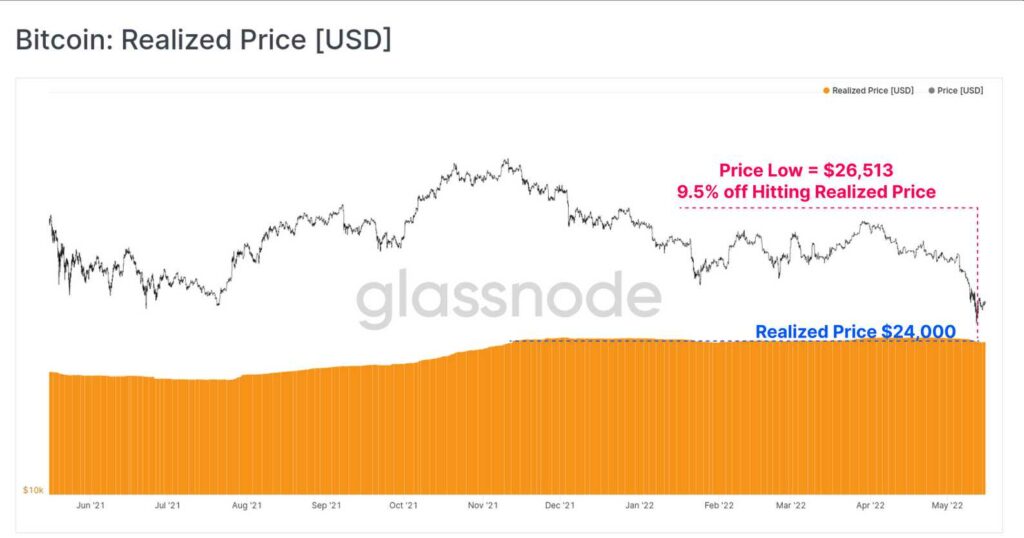
The above chart does not reflect the crosses of the spot price curve below the realized price curve mentioned in the table. It happens that in the period after 2021, the spot price remains above the realized price.
The following graph, since 2011, shows all the opportunities in which the spot price is lower than the realized price. Indeed, it is appreciated that at every opportunity that such a crossing occurs, the price of bitcoin is at the bottom of the respective bearish phase.

Although in the current bearish phase the spot price has not yet crossed the realized price curve, you are less than 10% away from achieving. According to historical data, for this to happen, the price of bitcoin would have to drop below USD 24,000, although the duration of that intersection, if it really happens, would be a few days. This, according to the trend seen in the table above.
Bitcoin’s bearish evolution drives accumulation
Bullish traders seemed to respond strongly to the price drop in the direction of the realized price, Glassnode notes. The graph and table below show the accumulation trend score (ATS) of bitcoin, the value of which varies between 0 and 1. As the ATS approaches 1, it indicates that a larger proportion of the market is increasing the BTC in their portfolios. The darker points on the price curve reflect a higher accumulation score.
As can be seen, on Thursday, May 12, when the market was at its lowest point, the accumulation trend score reversed from very weak values below 0.3, to yield values above 0.796.
As a backup to the rebound of the Bitcoin price to USD 30,000, the ATS took values above 0.9 for the rest of the week, which suggests that there was strong buy-side activity. This would be indicating that some traders are preparing for a future bullish season by buying the “dip”, that is, when the price touches its lowest point.
After touching the minimum indicated on May 12, the lowest level reached this year, the price of bitcoin has remained in a range between USD 28,000 and USD 31,000. This recovery was associated with a resurgence in purchases, among which institutional investments stood out in the last two weeks. In recent days the price has stabilized around USD 29,000, as we reported in this medium.


Comments