
After registering a new annual low last Thursday, May 12, the price of bitcoin (BTC) managed to improve above USD 29,000 for this Friday, following a moderate increase in demand. The rally comes in the midst of the seventh consecutive week in which, if realized, it would set a negative record in the history of bitcoin.
During the past week, there were some signs of the return of demand for bitcoin in the institutional sector, with the recovery of the capital flow of accredited companies and investors. The main bitcoin funds and ETFs received USD 40 million of institutional investment the first week of May, after losing USD 120 million in the previous week, according to the latest CoinShares report.
As can be seen in the following graph, after four consecutive weeks of capital outflow from bitcoin funds, an incoming flow of capital is recorded in said funds. Of this move stand out: USD 56.8 million received by the ETF of the Canadian company Purpose and USD 19.3 million invested in the ProShares ETF, according to CoinShares figures.
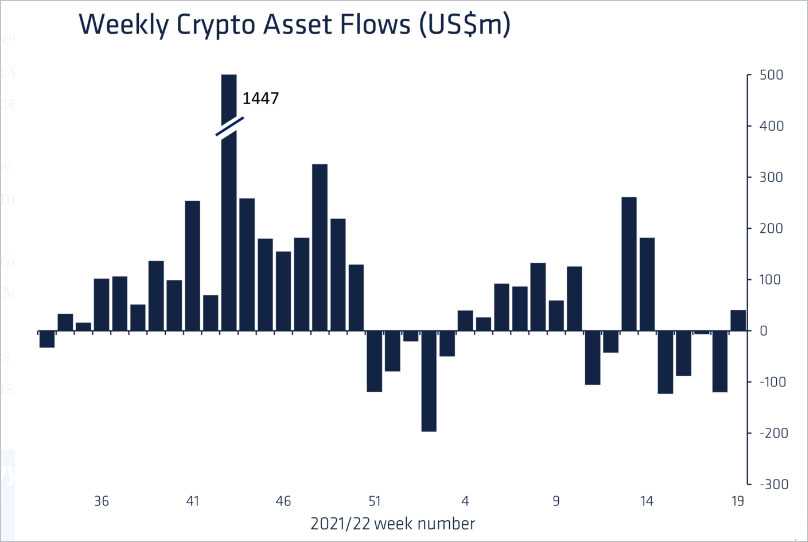
This week, the Purpose ETF performed the largest purchase of BTC since its creation. The 6,900 BTC acquired by Purpose is equivalent to USD 210 million, which quintuples the amount acquired by all funds and ETFs from last week.
Growing Bitcoin active addresses
While this is a metric of a lot of variability, the active Bitcoin addresses they surpassed the one million mark again this Thursday 12, according to the analytical firm Messari. From 960,119 active addresses 30 days ago, 1,058,679 addresses were registered this Thursday, a 10.27% increase.
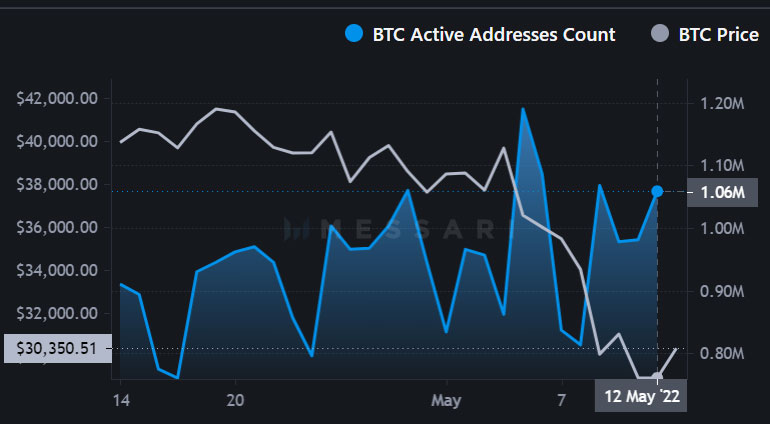
The Messari chart shows the evolution of Bitcoin addresses (blue) in the last 30 days, together with the price (white). It is worth clarifying that the number of addresses does not correspond to the number of bitcoin users, since a user can control more than one address.
Advertising

However, a growth trend of active addresses most likely corresponds to a boom in the number of users who are marketing. From the first of January to today, it went from 695,722 active addresses to 1.06 million, which represents an increase so far this year of 52.1%.
New metric signals bitcoin demand boom
The boom in addresses in recent days could be associated with the increase in the demand for BTC. About it, increase from the new Glassnode metric, the accumulation trend score (ATS), is showing a major boom of Bitcoin accumulation, as shown in the graph below.
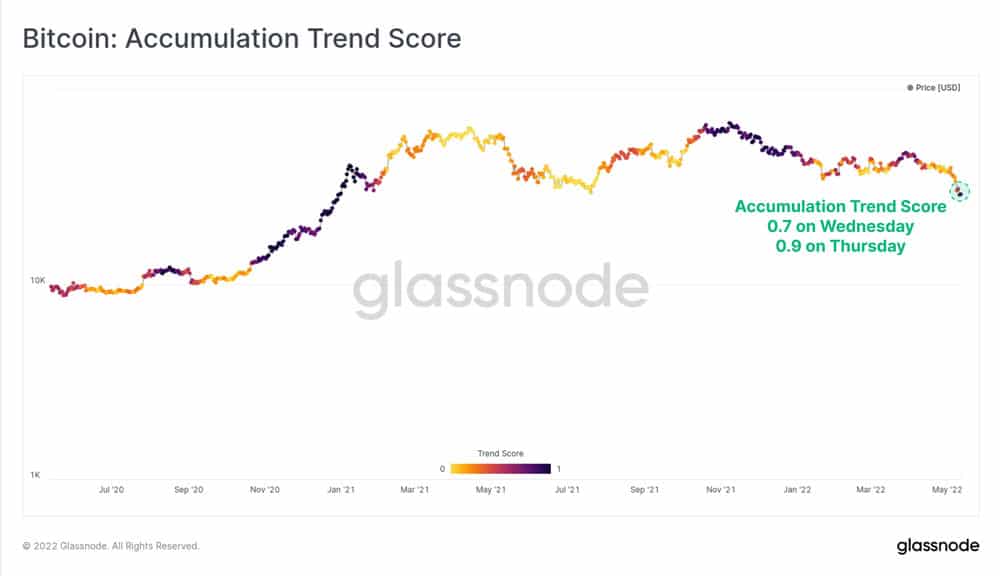
The colors on the price curve indicate the value of the accumulation score or ATS. The scale varies between 0, for the lowest values of accumulation in light colors, and 1, for the levels of high accumulation in dark colors.
Between Wednesday 11 and Thursday 12, the metric went from 0.7 to 0.9, which indicates a significant increase in accumulation in recent days. This suggests that investors are buying the dip or “bottom” of bitcoin, referring to the lowest price that a currency reaches in a certain period.
If we take into account that the BTC price touched USD 25,000 this week, its lowest point since December 2020, it is likely that many traders have put their capital to circulate to take advantage of the situation. This is a strategy that outlines the possibility that market participants consider that we will soon see bitcoin in higher numbers.


Comments