
Key facts:
-
For the first time in its history, bitcoin price falls for seven consecutive weeks.
-
Retracement to lowest value for a year and a half causes record BTC liquidations.
Markets a day is an exclusive summary of the news that moves the bitcoin economy. It is sent in advance by email to a list of subscribers and then published every Monday in Criptonews. If you want to have the information in advance, subscribe to the list here.
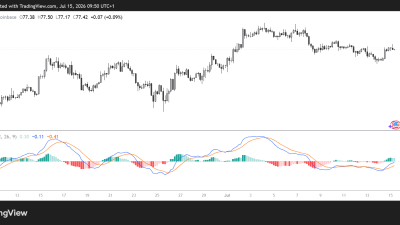
Despite a moderate rally in the price of bitcoin (BTC) last Thursday, May 12 and Friday, May 13, it is very likely that a seven-week descending pattern in the red will be completed this Sunday, for the first time in the history of bitcoin.
Last week was the sixth of continuous price retracement, as I reported this Monday 9 Crypto News, and the downward trend continued until Thursday 12. As can be seen in the following graph, that day was recorded a new year-to-date low of $25,401, a level not seen since December 2020.

The retracement of the bitcoin price so far this week is 13%. Despite the downtrend, starting from the mentioned low, a moderate surge in demand for this currency caused an upward price action, as detailed in the following section.
Institutional investment in bitcoin returns
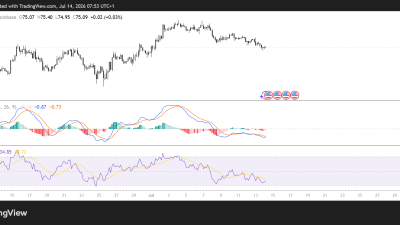
Since last week, new institutional investments in bitcoin have been registered, reflected in new capital inflows into bitcoin funds and ETFs, such as the Purpose ETF in Canada. This fund received a $56 million investment last week, and it made its largest bitcoin purchase since its creation this week: 6,900 BTC, equivalent to USD 210 million.
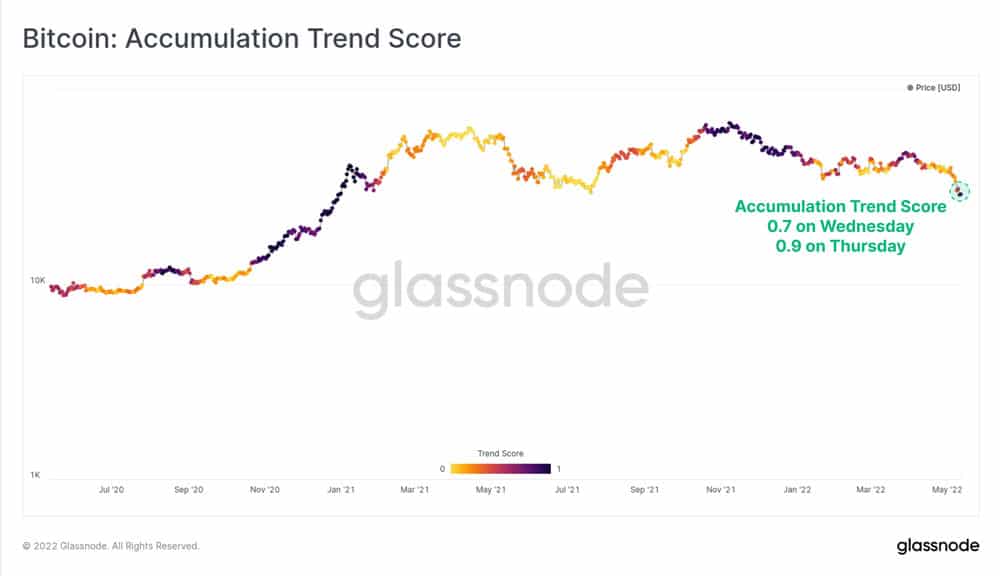
The graph shows the evolution of a new Glassnode metric that records the level of accumulation of bitcoin, the Accumulation Trend Score (ATS). The level of accumulation is expressed by the intensity of the color. Light colors indicate low accumulation, starting from zero. As the color gets darker it indicates more accumulation, with the maximum at 1.
Advertising

How low can bitcoin fall?
After touching USD 25,000, the market’s fear increased. The Fear and Greed Index, where lower values are associated with higher levels of fear, went from 12 last Thursday to 9, this Saturday. This indicates that the market believes that the price may fall further. Several analysts and traders are of the opinion that a further price retracement is possible. Some believe, however, that the decline will be temporary and that the price trend in the medium and long term is bullish. MicroStrategy CEO Michael Saylor recalled that since he announced his BTC accumulation strategy as part of the firm’s strategic reserve, the cryptocurrency has increased 149%.
Network profitability decreases 10%
With the fall in the price of bitcoin, 40% of the network addresses are at a loss, as reported by Criptonews last Tuesday, 10. At the end of March, the percentage of addresses in profit was 70% and in a week it dropped to 60%. For this reason, the number of addresses at a loss was raised to 40%.

This percentage corresponds, with few differences, to the portion of the supply and the entities that are at a loss. The graph shows the percentages of the three categories that are in profit: supply, entities and addresses. As can be seen, they evolve in a very similar way. With the publication of the new Glassnode weekly report, this Monday 16, it is possible to reach the neutral situation of 50% of directions in profit and 50% in loss.
Featured graphic of the week
In the previous section we appreciated how the directions and the supply in loss increase, while the percentage of those parameters in gain decrease. These are symmetrical, mirror-like evolutions around the 50% line. The following graph shows the two curves that, as we see, overlap at a certain moment, when the supply in profit is less than 50%.

These areas of overlap they have historically corresponded to bitcoin price floors in 2011, 2015, 2019 and 2020. The hypothesis used here is that an overlap is approaching, so we could be close to a new price floor that precedes a bitcoin bull run.
BTC liquidations reach record high
Last Thursday, the 12th, coinciding with the minimum of the aforementioned price, bitcoin registered a record value of settlements of USD 2,200 million, as we reported on this information portal. In the midst of the price collapse, traders mostly bet on a steeper decline, although a subsequent price rally led to the liquidation of those bearish positions. The liquidations increased by more than 150% that Thursday, compared to what was liquidated the previous day.


Comments